When you launch your presentation at runtime, you can see and interact with the slides as your reader will. The presentation's runtime content includes features that allow you to interact with your analytic data, such as generation of Smart insights, changes using the Chatbot, and resizing panels.
As you work on your presentation you should look at the runtime version frequently, this will help you to ensure that it is sufficiently useful for your audience.
Launch the presentation at runtime from Present
Present Pro
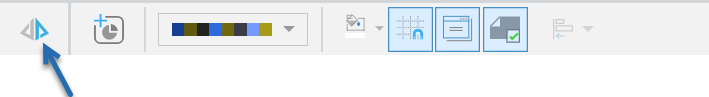
You can use the options on the overhead ribbon to launch the presentation:

- Click the Pyramid Run button (green arrow) or press F2 on your keyboard to run the presentation from the current slide.
- Click From Beginning on the Presentation ribbon (purple highlight) to run the presentation from its first slide.
Note: In either case, you can navigate to the other slides in the presentation using the same navigation options that will be available to your readers.
Present Lite
In Present Lite you can click the Pyramid Run button or press F2 to run the presentation from the current slide:
Context Menu
Wherever you see an explorer-style list of content items (from your Home Page or in the Content Explorer for Pros, Analysts, or Viewers), you can run any presentations as follows:
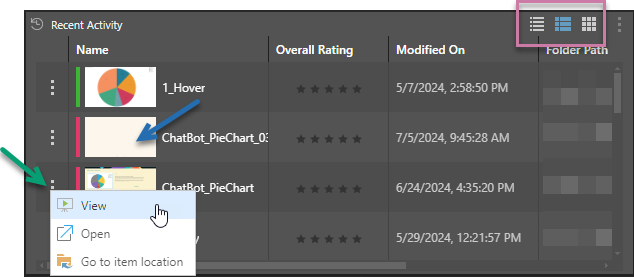
- Click the Ellipsis (...) and select View from the menu (green arrow).
- If the presentations are shown as a list (details or content view), right-click anywhere in the row representing the presentation (snapshot, name, or any other value) and select View from the menu.
- If the presentations are shown as tiles, right-click anywhere in the name panel and select View from the menu.
Tip: You can change the type of list that is used for a panel using the view options at the panel's top-right (purple highlight).
Launch runtime presentation in a browser
Direct Load
- Open the presentation in a browser using its URL link.
Tip: A presentation's URL link can be accessed from its Metadata panel.